Introduction
What can CGRM do?
CGRM platform provides a web-based pipeline to directly identify the targets of multi-level regulators TFs, miRNAs and lncRNAs through an integrated analysis of various data types. The modeling systems of CGRM are based on our previously reported LogicTRN and RCA, which have been shown to be effective and reliable in decoding distinct regulatory programs of cardiac TFs, miRNAs and lncRNAs during dynamic processes of heart development.
The web interface provides users the heart data resources so that they have the option of submitting the existing data or providing self-defined data. The workflow of CGRM produces output tables, which can be downloaded for further association analyses of regulator interaction, heart function, disease genes/biomarkers, and so forth. This platform as the first web-based platform can use gene regulatory modeling to uncover dynamic transcriptional gene regulation in a high-throughput manner.
1. LogicTRN
LogicTRN introduction
LogicTRN is designed to identify regulatory logics formed by TFs by integrating time series gene expression data and TF-DNA binding information. This method can quantitatively characterize logic relations between TFs by combining cis-regulatory logics and transcriptional kinetics. The derived TF logics are then used to infer the putative TF cooperation in regulating target genes and to reconstruct transcriptional gene regulatory network (GRNs).
1.2 Input files
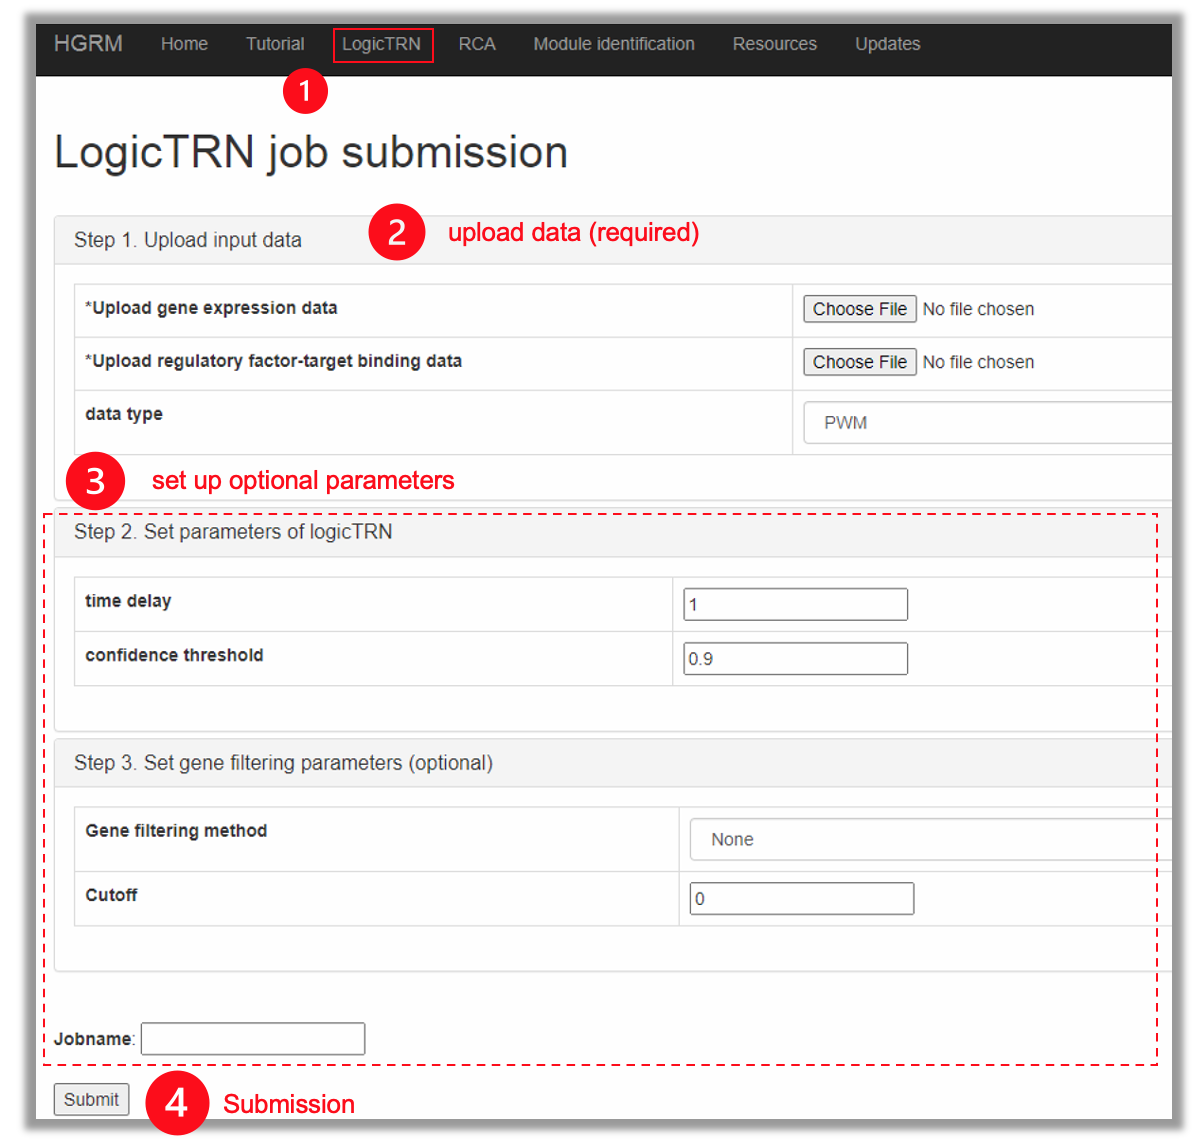
LogicTRN requires two input files.
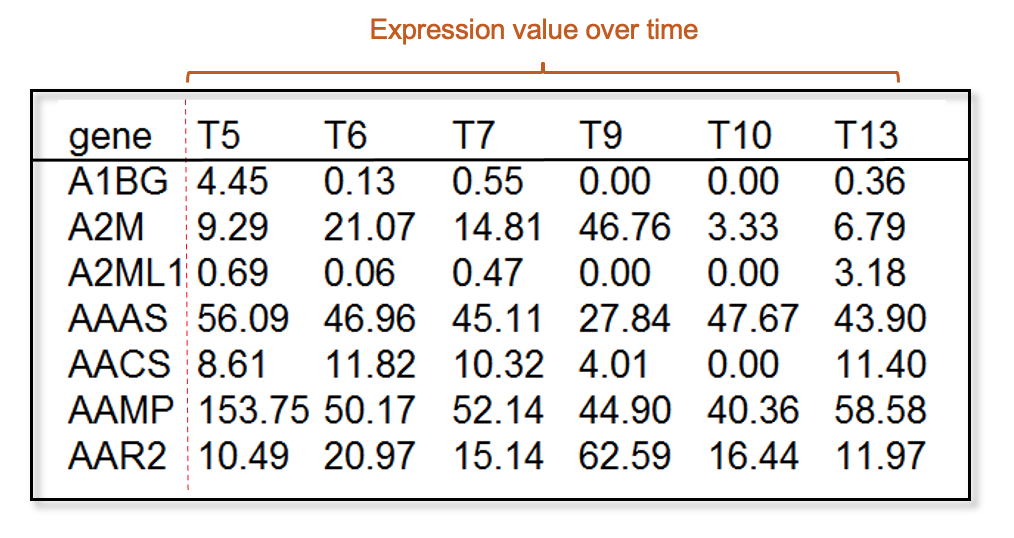
1.2.1 Time series gene expression data
Input time series mRNA expression data accepts two type formats: tab delimited TXT file and comma delimited CSV file (Download the toy data). Note that the sample names representing time points should be in the ascendant order. If multiple samples have the same time point, the columns should keep the same names, for example T5 T5 T5, or day 5 day 5 day 5.
1.2.2 TF-DNA binding data
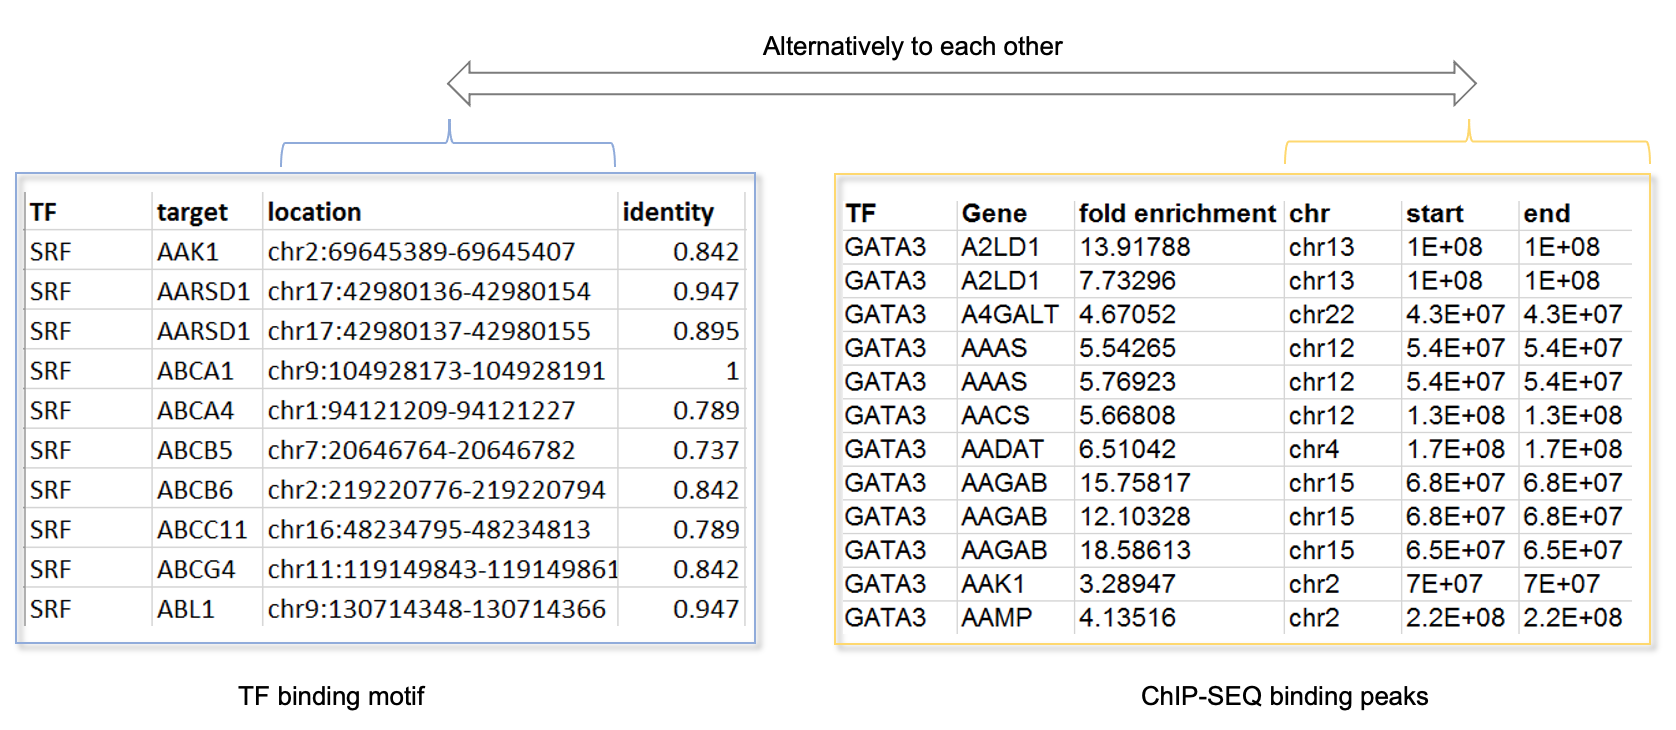
TF-DNA binding data accepts two type formats, tab delimited TXT file and comma delimited CSV file. It has two types, 1) ChIP-Seq binding peaks of TFs, 2) TF binding sites on promoters. In this platform, we provide promoter binding sites of TFs which are important for heart development and function(see Resource)
For TF binding site data (Download the toy data), each column represents as following meaning.
| Column name | Description |
| TF | The name of transcriptional factors (TFs) |
| target | The name of the target genes |
| location (alternatively to columns of [chr, start, end]) | The binding site position |
| chr (alternatively to the column [location]) | chromosome of the binding |
| start (alternatively to the column [location]) | The start position of binding site |
| end (alternatively to [location]) | The end position of binding site |
| identity | The identity of the binding site (0-1) |
For ChIP-Seq data (Download the toy data), columns would be automatically detected if named as following shows:
| Column name | Description |
| TF | The name of transcriptional factors (TFs) |
| target | The name of target genes |
| Fold enrichment | The fold enrichment of the binding peak |
| location (alternatively to columns of [chr, start, end]) | The binding position |
| chr (alternatively to the column [location]) | chromosome of the binding |
| start (alternatively to the column [location]) | The start position of binding site |
| end (alternatively to [location]) | The end position of binding site |
1.3 Parameters
CGRM provides a set of parameters to run the computational models. Users are allowed to tune it on according to their own needs.
The logicTRN model has two types of parameters, 1) algorithm parameters that are used to model construction, and 2) gene filtrating for obtaining genes with specific biological meaningful or significant expression change.
Algorithm parameters
We set default parameters to run logicTRN, while it was recommended from the original paper (see reference 1) based on the user’s customized demand
| Parameters | Description |
| Delay | The time delay of the TF binding effect on the gene expression. (default: 1) |
| Confidence of the identified logics | The value which is chosen can identify unique regulatory logics of TFs among the predicted logics. Only TF logics with confidence larger than this parameter will be included to output dataset. (default: 0.9) |
Gene filtering
This server provides several methods to select the genes in the input gene expression data, especially RNA-seq data.
| Filtration method | Description |
| Sum | The genes with sum of the expression values of all samples lower than the cut-off will be removed. |
| Average | The genes with average values of the expression values of all samples lower than the cut-off will be removed |
| LogFC | The genes with fold change average values of the expression values of all samples between different samples, time points, the lower than the cut-off will be removed |
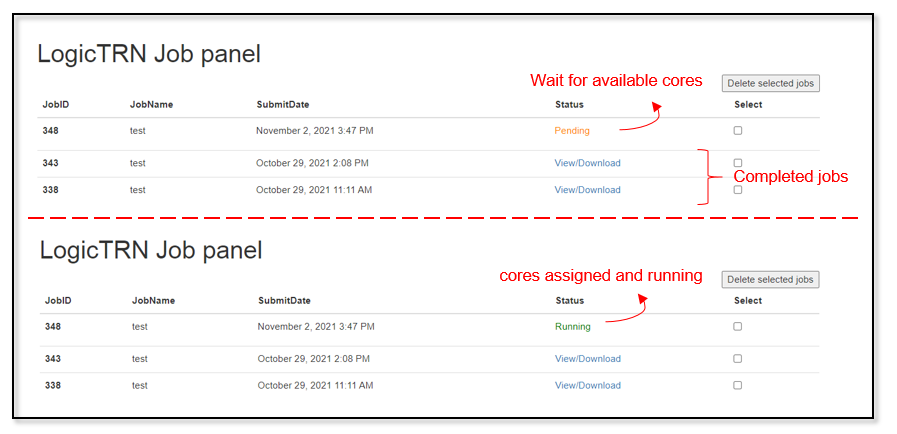
1.4 Job submission and tracking the status
Once the parameters are set up, users can click submit button to upload it to the server. The running time varies due to the input size, while the server uses first-come-first basis with multiple running queue. All of the submitted job status and results are shown in the logicTRN panel. If the cores are available, the job will be returned with running in a few seconds after refreshing the page. Otherwise, it shows pending, meaning that all of the cores are occupied by other users, and getting the current job number, under the waiting queue. If it shows runtimeError, it indicates an error and captured during running the program. Usually, it is caused by non-standardized input files, please check them and submit again. If this error keeps occurring, please contact the admin. After the job completed, A notification E-mail will be sent to the user. User can also check and download it through the link in the job panel.
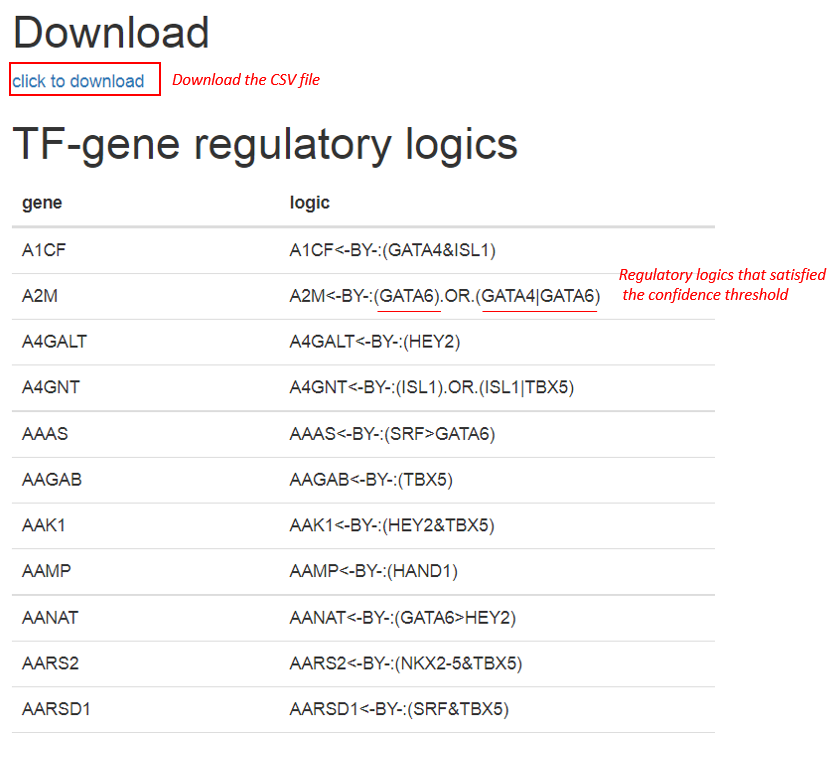
Output
The output of logicTRN can be interpreted as two parts. Firstly, if there exists multiple TF logics that are predicted to regulate a target gene, the logics will be shown as: (TF logic 1).OR.(TF logic 2), indicating either TF logic 1 or TF logic 2 is potential regulator. Second, TF logics are represented by three logic symbols:"&", "|", ">", to represent AND, OR, and NOT logic respectively. The AND logic describes the situation that the gene is only activated when the two TFs concurrently binding to the gene promoter, and OR logic represents that the gene can be independently activated by either of the two TFs, while NOT logic characterizes the inhibitive operation. In the outputs, for example, “TF1 & TF2”, refers to common action by the two TFs, “TF1|TF2” to either TF1 or TF2 action, and “TF1<TF2” to TF1 prior to TF2. It is free to download the full list of the logicTRN results, which contains involved TFs and the regulatory logics on every target gene.
2. RCA
RCA introduction
RCA was designed for identifying regulatory module by matrix decomposition. This model requires two types of input data. 1) regulatory factors (TFs, lncRNA and miRNA, etc.) and targets interaction data, which can be obtained from experimental test or computational analysis. 2) mRNA expression data, X matrix. Because of sparseness of the RCA model, it is suggested to restrict number of regulatory factors not greater than total sample size. From the target-regulator pairs and X matrix, RCA will learn and compute the regulatory activity profile, Z matrix; Based on X=YZ, RCA is able to produce Y matrices, accounting for the possibility of genes is regulated by input factors. By compare the results from the input regulator-target data and from permutation test, the RCA system can calculate the p-value as a candidate cut-off for predicting targets.
The pipeline of RCA consists of three steps:
- Compute the regulatory strength from the input regulator-target binding data;
- Generate random target-regulator pairs and compute the regulatory activity profile, Z matrix;
- Generate the output matrix Y, and this procedure is based on permutation random test for calculating the p-values. For details, please refer to: RCA paper
2.1 input data files
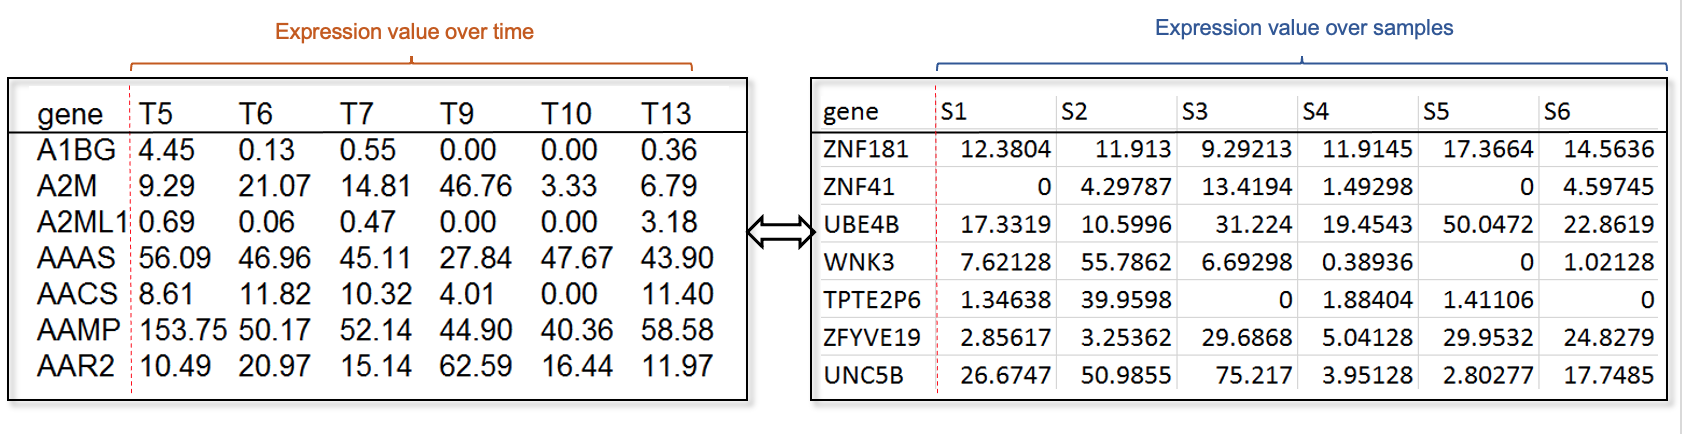
2.1.1. mRNA expression data
mRNA Expression table, i.e., X matrix, is one of the mandatory upload file of RCA. Tab delimited TXT file and comma delimited CSV file are allowed. Basically, the first column should be gene identifiers and other columns represent samples or time points. Noted that the header of samples or time points should be unique.(Download the toy data)
Note: as suggested in the original RCA paper, please make sure that the number of samples/the number of time points >= the number of regulatory factors.
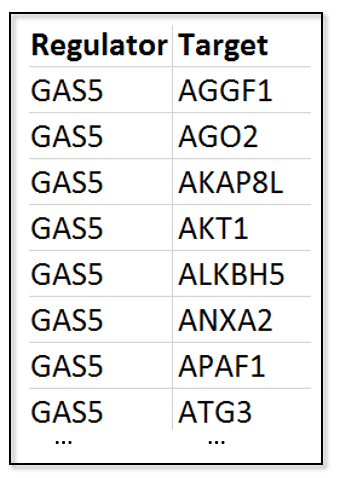
2.1.2 Regulator-target binding data
Regulator-target binding or interaction data is one of the mandatory upload files of RCA. Tab delimited TXT file and comma delimited CSV file are allowed. Columns would be automatically detected if named as following shows: (Download the toy data)
| Column name | Description of column value |
| Regulator | The name of regulators |
| Target | The name of the target genes |
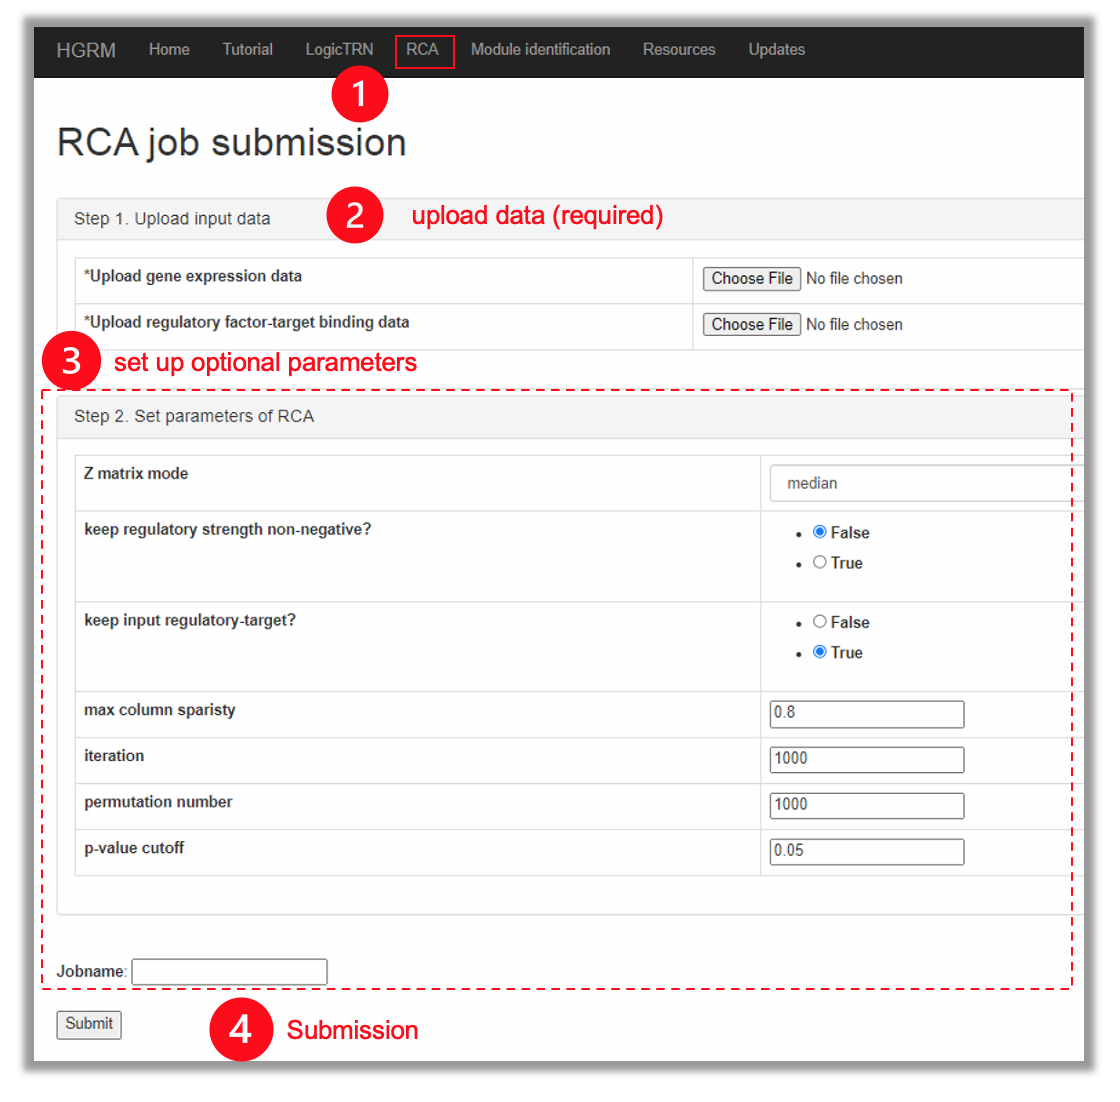
2.2 Parameters
The tunable parameters of RCA are listed below:
| Parameter | Description |
| Z matrix mode | three ways to construct the regulatory profile (Z matrix) is provided: median, k-means and pca, the default method is median. |
| Keep regulatory strength non-negative? | Set this parameter as True to make the fitted regulatory strength always non-negative in each of the iteration. |
| Keep input regulator-target? | Set this parameter as True to make regulatory strength of the input regulator-target pairs as non-zero in each of the iteration. |
| Maximum column sparsity | Set the max sparsity score of columns(default: 0.8) |
| iteration | Iteration number (max:1000) for generating Z matrix |
| Permutation number | Permutation test number (max:1000) |
| p-value cutoff | Compared with the Y matrices generated from permutation test, the p-value cut-off is used to select most likely targets of regulatory factors (default: 0.05) |
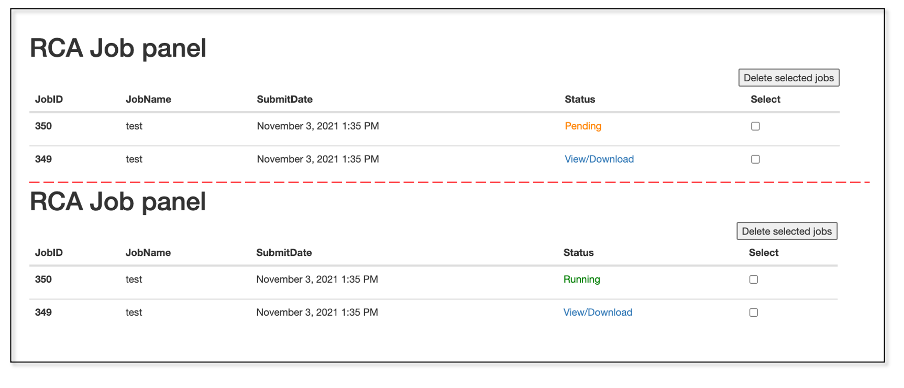
2.3. Job submission and status tracking
Currently, we got multiple job queues. After job submission, users can go to user’s RCA job panel to check the job status and results. If the cores are available, the job will be returned with running in a few seconds. Otherwise, it shows pending, meaning that all of the cores are occupied by other users, and the current job is under waiting queue. If it shows runtimeError, indicating that errors are captured during running the program. Usually, it is due to non-standardized input files. Thus, users need check the input files and can submit again. If the errors continue to be detected, please contact the administrator group. After the job completed, A notification E-mail will be sent to the user.
2.4 Output
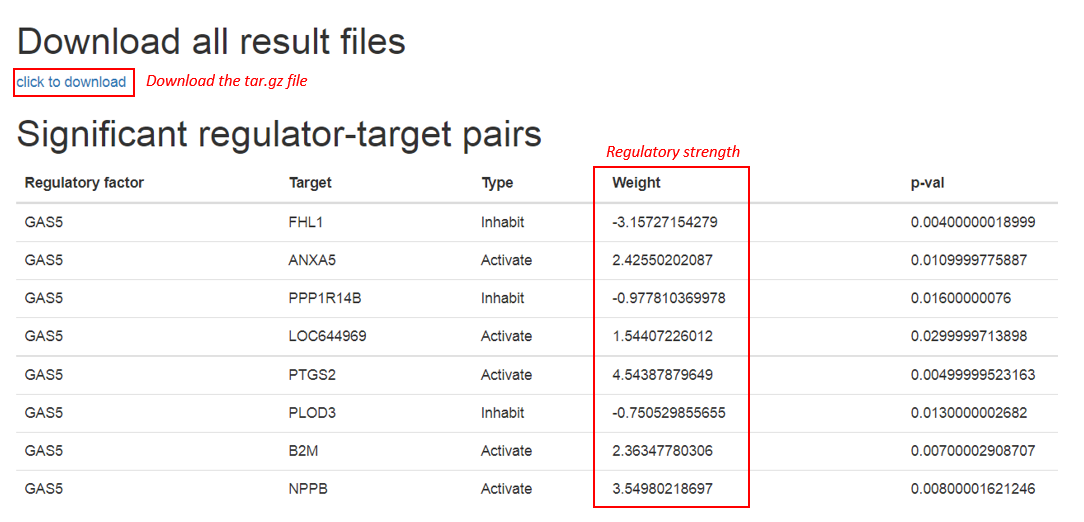
The output of RCA consisted of 5 components: regulatory factor, target, type, weight and p-value. Specifically, weight means the regulatory strength which is derived from matrix factorization by the input regulator-target relationships and expression profile, i.e. X matrix. p-value is an indicator for identifying most likely factors-target regulatory interaction relationships, which is calculated through permutation test
Users can download the all of the result files through the download link. The most likely regulatory factors, the target, their regulatory type and strength, and cutoff p-values provided in the compressed file. While output regulator-target pairs are also presented in the web page for users to browse.
3. Interaction and association
interaction and association includes two sub-modules: 1. interaction analysis, 2. gene set enrichment
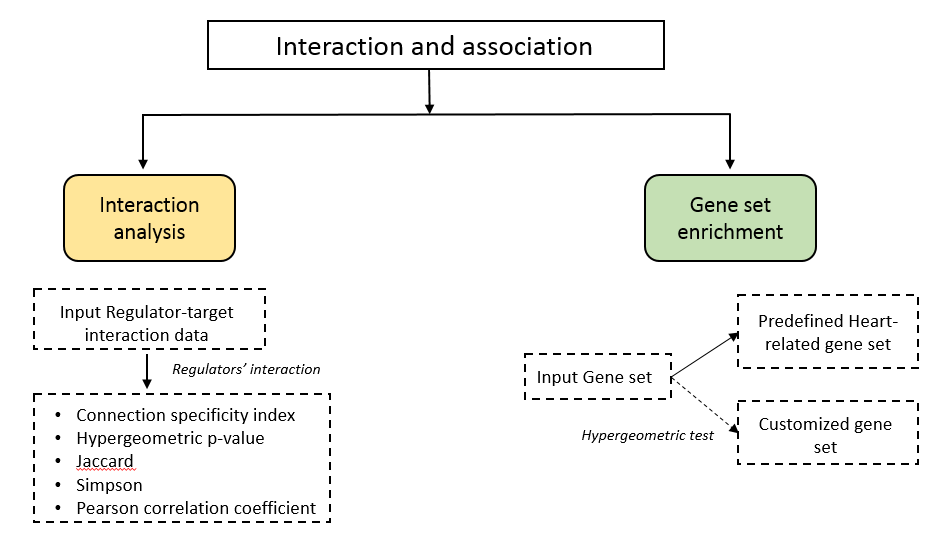
3.1. Interaction analysis
To quantify the interaction among regulators and the target gene sets, we have coordinated four methods for calculate the association indexes. On the “Interaction and Association”, there are connection specificity index (CSI), Jaccard index, Simpson index, Pearson correlation coefficient, and hypergeometric p-value of over-representation test.
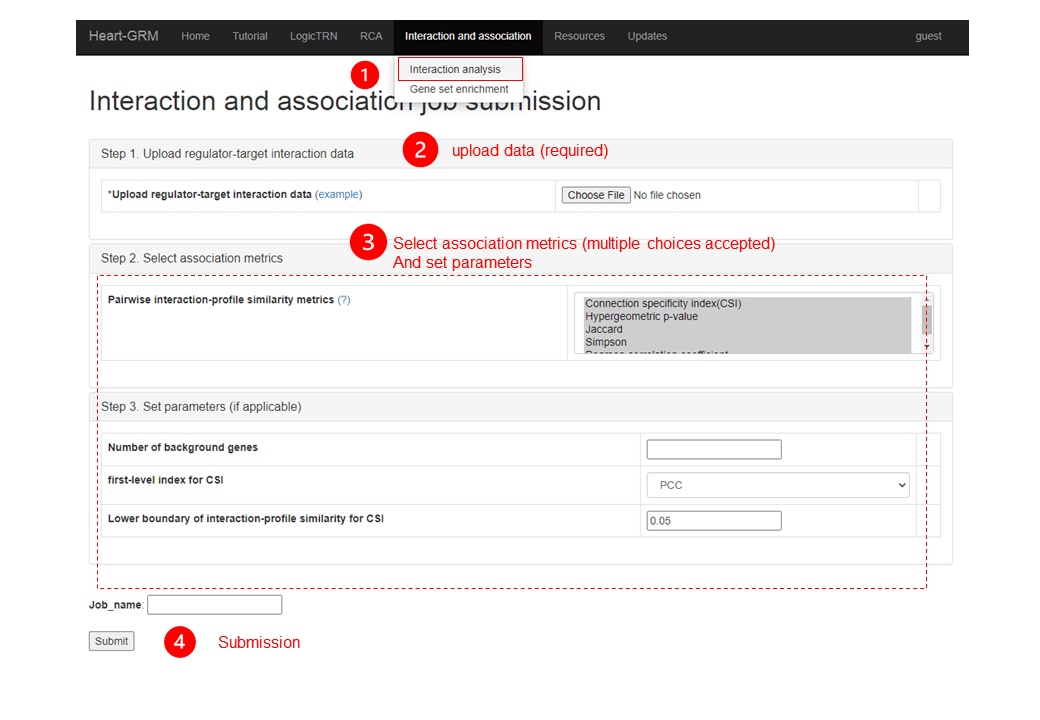
3.1.1 Input files of interaction analysis
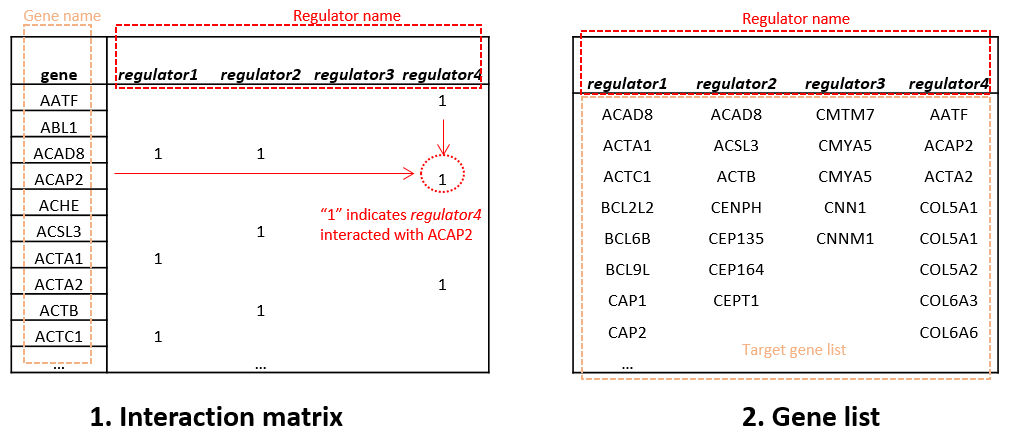
Two types of the input files are accepted, tab-delimited TXT and comma-delimited CSV are accepted.
- Interaction matrix (Download the toy data), the first column is gene names, and other columns starting from the second represents the interaction relationship of regulators, functional categories, disease types, or other factors with the corresponding genes. Here, "1" denotes the interaction relationship, while empty cell or "0" denotes no interaction relationship.
- Gene list (Download the toy data), the first row is the names of regulators, functional categories, disease types, or other factors and the corresponding genes are listed under them.
3.1.2. Descriptions of the association metrics
The principal of the association between two regulators is based on their shared target genes and the structure of the regulatory network. The equations of the metrics are shown below. T(X) denotes the target genes of X regulators.
The appropriate selection of the metric is based on the research objective, please refer to the this paper for detailed analysis and suggestions.
- Jaccard index takes the ratio of intersection over union of the targets of A, B. $$Jaccard_{AB} = \frac{\mid T(A) \bigcap T(B) \mid}{ \mid T(A) \bigcup T(B) \mid}.$$
- Simpson index, also known as overlap coefficient, is defined as the intersection divided by the smaller target set of A, B. $$Simpson_{AB}=\frac{\mid T(A) \bigcap T(B) \mid}{\min(\mid T(A) \mid, \mid T(B) \mid)}.$$
- The Pearson correlation coeffcient evaluates correlation between two nodes by taking into the shared targets and number of the background genes in the network \(n_{y}\) $$PCC_{AB}=\frac{\mid T(A) \bigcap T(B) \mid \cdot n_{y} - \mid T(A) \mid \mid T(B) \mid}{\sqrt{\mid T(A) \mid \cdot \mid T(B) \mid \cdot(n_{y}-\mid T(A) \mid)\cdot(n_{y}-\mid T(B) \mid)}}.$$
- The connection specificity index (CSI) takes into the other nodes that connected to A or B into account,which is defined as the fraction of regulators that have an interaction profile similarity with A and B that is lower than the interaction profile similarity between A and B itself. Noted that the interaction profile is calculated based on the first-level index, which is PCC as the default in this platform. And there is also a threshold s for determining the similarity. $$CSI_{AB}=\frac{\mid\ nodes\ that\ connected\ with\ A\ and\ B\ with\ first\ level\ index\ <\ first\ level\ index\ (A,B) - s\mid}{\mid\ total\ number\ of\ regulators\mid} .$$
- Hypergeometric p-value is the an index for determining the siginificance for the similarity of two regulators.The number of the background genes is marked as \(n_{y}\). $$hyperP_{AB}=1 - \frac{C_{\mid T(B) \mid}^{\mid T(A) \bigcap T(B) \mid-1} \cdot C_{n_{y}-\mid T(B) \mid}^{\mid T(A)\mid-\mid T(A) \bigcap T(B) \mid +1}}{C_{n_{y}}^{\mid T(A)\mid} } .$$
3.1.3. Parameters of interaction analysis
| Column name | Description |
| Number of background genes | Required for hypergeometric p-value, PCC and CSI if use PCC as the first-level index. |
| First-level index for CSI | First level for interaction-profile similarity calculation in CSI.Default:PCC |
| Lower boundary of interaction-profile similarity for CSI | Default:0.05. |
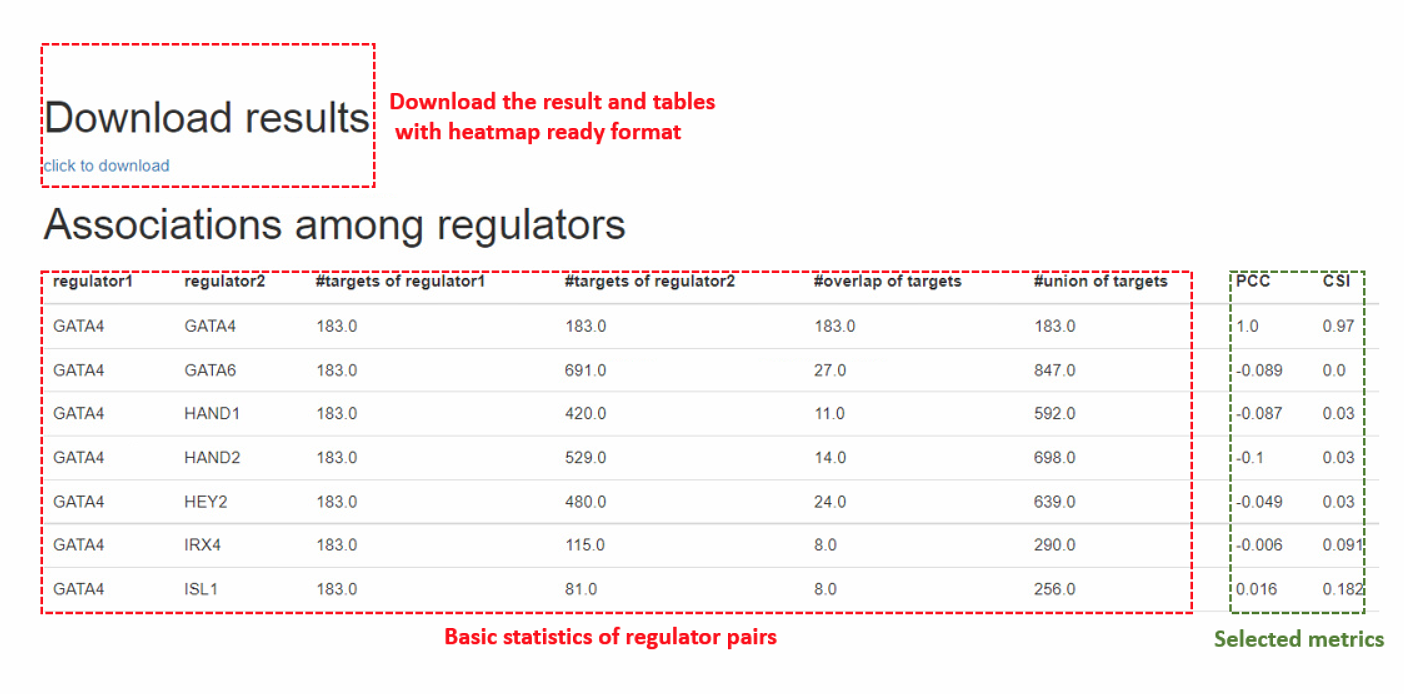
3.1.4. Output of interaction analysis
The output result will produce the pairwise associations based on users’ metric selections. For the convenience of users, we also provided the heatmap-ready format files for each of the association indexes in the download package.
3.2 gene set enrichment
In the submodule gene set enrichment, hypergeometic tests are performed to test if the genes of interest are overrepresented in the predefined heart related gene sets (see resources). In addition to the predefined sets, user-customized gene sets are also allowed.
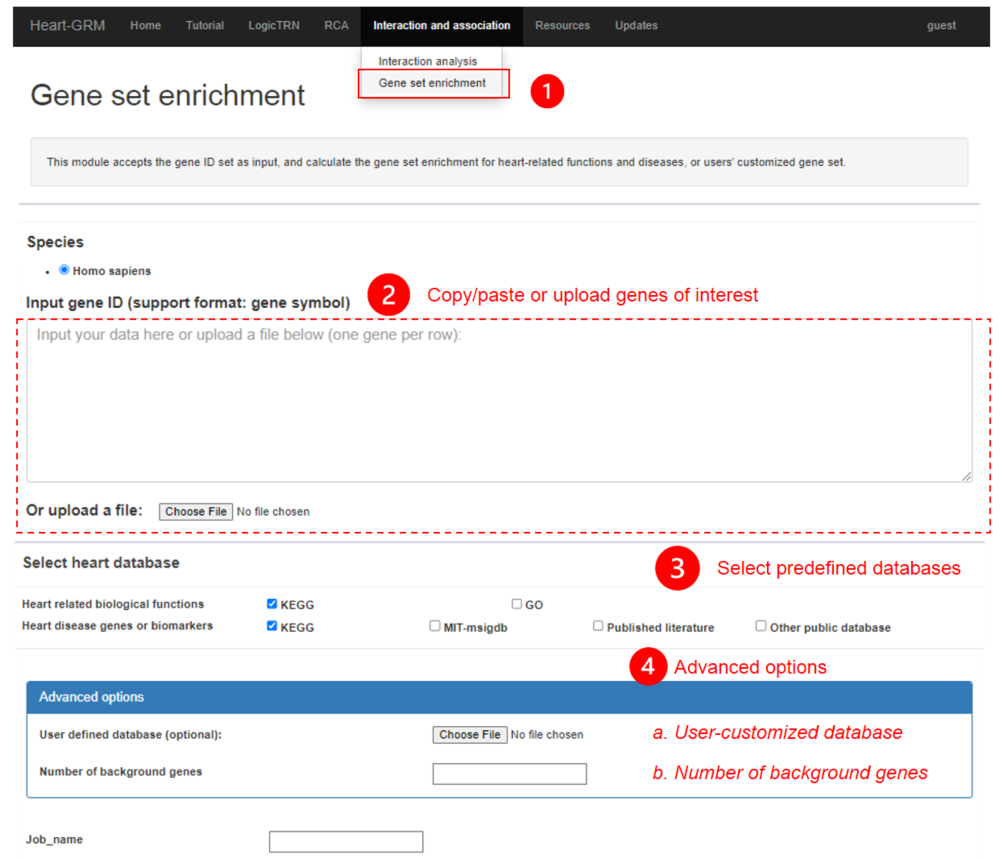
3.2.1 Input of gene set enrichment
Users can either copy/paste the genes of interest in the text box or upload the TXT or comma-delimited CSV files (one gene per row)
3.2.2. Parameters of gene set enrichment
There are three steps to run the module of gene set enrichment:
- Select a database.
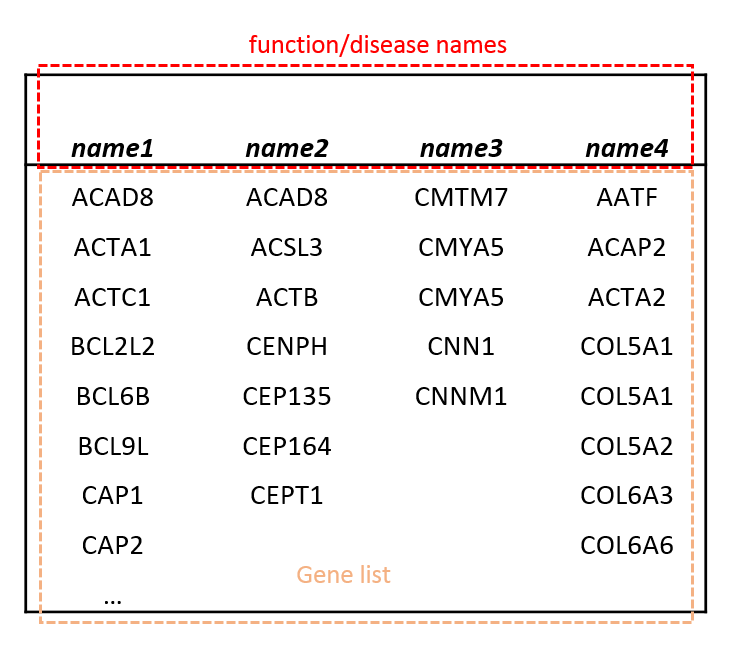
- Upload customized dataset, supported format shows as following:
- Set the number of the background genes, which usually be the total number of sequenced genes.
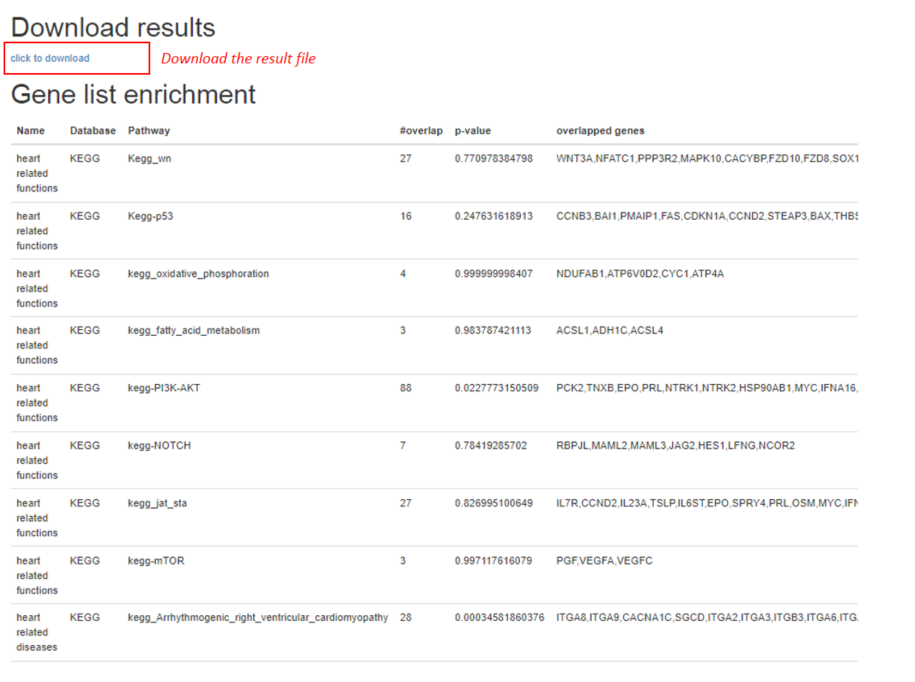
3.2.3. Output of gene set enrichment
The results will be generated based on users' selection on the databases, a sample result page is shown below:
3.3. Job submission and tracking the status
After job submission, users can go to the interaction and association job panel to check the job status and results. Currently, we have multiple job queues for running. If the cores are available, the job will be returned with running in a few seconds. Otherwise, it shows pending, meaning that all of the cores are occupied by other users, and the current job is under waiting queue. If it shows runtimeError, indicating that errors are captured during running the program. Usually, it is due to non-standardized input files. Thus, users need check the input files and can submit again. If the errors continue to be detected, please contact the administrator group. After the job completed, A notification E-mail will be sent to the user. User can also check and download it through the link in the corresponding job record in the job panel.